


In 2025, love and politics are colliding for many LGBTQ+ singles.
A new Kinsey Institute and DatingNews survey finds that 1 in 4 are changing how they date amid the political climate.
The State of Us: National Study on Modern Love & Dating in 2025 shows politics are affecting LGBTQ+ singles across demographics, however Gen Z ages 18-25 are feeling the most impact.
Among the overall sample of 302 respondents:
- 25% of LGBTQ+ singles say politics have changed how they date
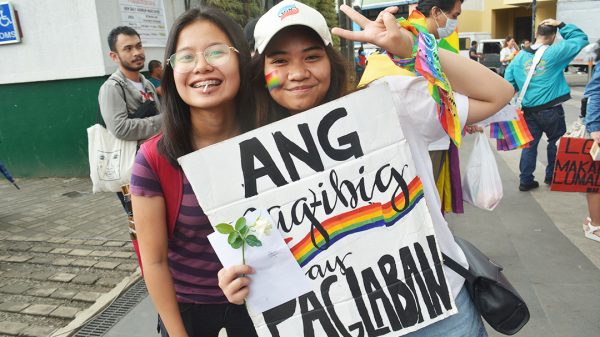
- 35% of LGBTQ+ adults say they don’t feel safe being open about their identity while dating
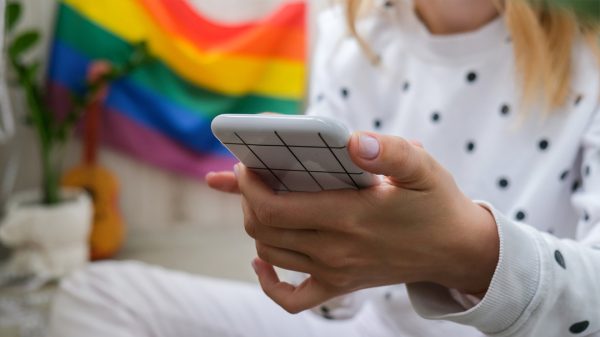
- 18% of respondents said they are taking extra measures to protect their identity and privacy in online dating
- 10% of LGBTQ+ adults say they are less comfortable visiting LGBTQ+ venues
Gen Z appear most affected:
- 44% of Gen Z adults (aged 18-24) say they don’t feel safe being open about their identity while dating compared to only 5% of LGBTQ+ seniors age 65+
- 1 in 4 say they are taking extra measures to protect their identity and privacy online in online dating
- 21% have relocated to more LGBTQ-friendly areas
“These findings provide pretty clear evidence that the current political climate is having a significant impact on the way that many LGBTQ singles are approaching dating. However, the effects seem to be most acute for the youngest LGBTQ persons,” said Kinsey Institute Senior Research Fellow Dr. Justin Lehmiller.
“Older LGBTQ (people) appear to be a bit more resilient to the current political challenges, perhaps because they have weathered these kinds of attacks for decades and have found other ways to cope.”
The DatingNews.com and Kinsey Institute State of Us: National Study on Modern Love & Dating in 2025 was led by Kinsey Institute researchers Dr. Justin Lehmiller and Dr. Amanda Gesselman, with data collected and conducted by Prodege.com among a nationally representative sample of 2,000 single US adults ages 18 to 91 via an online survey from April 29, 2025, to May 8, 2025. The sample was balanced to ensure a reliable and accurate representation of the U.S. population in terms of age, gender, household income, geographic region, and race/ethnicity. Overall, 15% of the sample (302 respondents) identified as LGBTQ+.